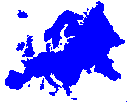
Growth of the internet in Europe
This is the growth of the number of internet
hosts in Europe from 1990 to 2011.
1990 – 30,000
1991 – 130,000
1992 – 284,000
1993 – 553,000
1994 – 1,029,000
1995 – 2,206,000
1996 – 3,674,000
1997 – 5,790,000
1998 – 7,872,000
1999 – 10,268,000
2000 – 15,804,000
2001 – 22,332,000
2002 – 27,241,000
2003 – 33,708,000
2004 – 53,965,000
2005 – 71,888,000
2006 – 87,606,000
2007 – 121,869,000
2008 – 140,131,000
2009 – 152,847,000
2010 – 166,570,000
2011 – 179,514,000
This is a growth chart, from 1993 to 2011.
Internet
hosts in Europe
1993-2011
Numbers
in millions
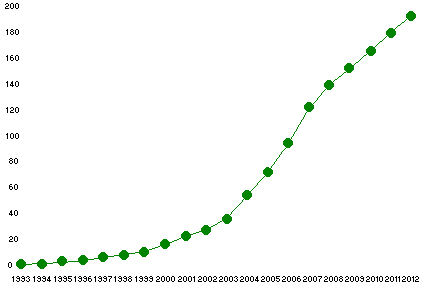
Internet activity in Europe increased 39 percent in 2007, 15 percent in
2008 and “only” nine percent in 2009 and 2010, 8 percent in 2011.
Is growth getting (relatively) slower? Maybe, but it’s still remarkably
fast compared to any other economic or social trend. For a comparison with
other parts of the world, see the “large areas” graphs and comments
in the analysis of international data.
Situation of the internet in Europe
This table analyzes data for the 45 European countries
with over 10,000 internet hosts.
| |
Number of hosts
December 2011 |
Per 1000
inhabit. |
| Germany * |
30,000,000 |
365.6 |
| United Kingdom * |
27,000,000 |
436.2 |
| France * |
26,000,000 |
399.8 |
| Italy |
25,455,561 |
419.9 |
| Spain * |
17,000,000 |
362.8 |
| Russia |
13,757,722 |
97.0 |
| Netherlands |
13,715,032 |
823.5 |
| Poland |
12,928,122 |
338.6 |
| Sweden ** |
5,806,123 |
616.6 |
| Switzerland |
5,249,367 |
667.4 |
| Belgium |
5,179,959 |
494.3 |
| Finland |
4,699,507 |
874.3 |
| Denmark |
4,284,533 |
770.5 |
| Czech Republic |
4,140,126 |
393.1 |
| Portugal |
3,644,339 |
341.4 |
| Norway |
3,583,945 |
728.4 |
| Austria |
3,444,552 |
411.3 |
| Greece |
3,114,925 |
275.5 |
| Hungary |
3,063,519 |
305.9 |
| Romania |
2,715,415 |
126.5 |
| Ukraine |
1,997,268 |
43.7 |
| Slovakia |
1,387,022 |
255.2 |
| Ireland |
1,379,364 |
300.9 |
| Croatia |
1,344,819 |
305.0 |
| Lithuania |
1,189,700 |
345.3 |
| Serbia |
1,106,234 |
150.6 |
| Bulgaria |
937,615 |
127.5 |
| Estonia |
848,009 |
656.8 |
| Slovenia * |
700,000 |
341.5 |
Moldova |
696,685 |
169.1 |
| Iceland |
360,901 |
1134.9 |
| Georgia |
358,109 |
76.7 |
| Latvia |
344,926 |
153.4 |
| Belarus |
302,560 |
31.9 |
| Luxembourg |
253,959 |
505.9 |
| Armenia |
192,541 |
59.2 |
| Bosnia Herzegovina |
146,152 |
38.3 |
| Macedonia |
65,967 |
32.1 |
| Azerbaijan |
29,968 |
3.3 |
| Andorra |
28,131 |
331.0 |
| Monaco |
28,018 |
778.3 |
| Malta |
26,946 |
65.2 |
| Albania |
15,505 |
4.9 |
| San Marino |
11,097 |
346.8 |
| Montenegro |
10,188 |
16.3 |
| on .eu domains |
173,527 |
|
| European Union |
150,457,000 |
299.2 |
| Europe |
179,514,000 |
249.6 |
* Hostcount figures
for Germany, the UK, France, Spain and Slovenia appear understated
at this
time and therefore the numbers are arbitrarily, but not unreasonably,
increased.
** The
number for Sweden includes hosts on “.nu” domains as well as “.se”.
One of the relevant changes in the last ten years was the
growth of the Netherlands, that in 2004 reached the traditionally
high level of Scandinavian countries. France has been growing faster
since 2004 (and has overtaken the Netherlands in 2006.) There is
continuing growth in Eastern Europe, with a particularly strong
development in Poland – and also in other countries, especially
in the Czech Republic, Hungary, Romania, Slovakia and Croatia.
There is fast growth in Russia in 2009-2011.
It’s interesting to note that there is still considerable
growth in several high-density countries. The development of the
internet shows no signs of “saturation” anywhere.
There are now eleven countries in Europe with over five million
internet hosts (of twentytwo wordlwide.) Eight in Europe
over ten million (nine in the rest of the world.)
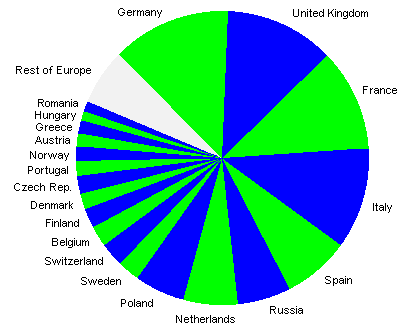
The next graph summarizes the situation in the 20
European countries with over two million internet hosts.
20
European countries
The next graph shows density (hosts per 1000 inhabitants) in
the 35 European countries with over 100,000 internet hosts.
Internet hosts
per 1000 inhabitants
in 35 European countries
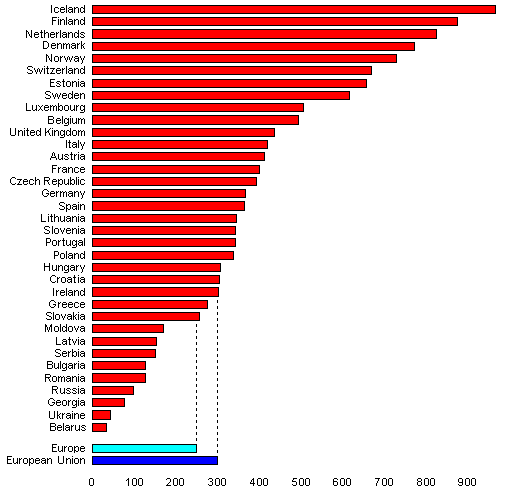
There are changes compared to a year or two earlier, with considerable
growth in several places, but there is still a large difference between the
most advanced countries an the rest of Europe.
As we did worldwide in the
international analysis,
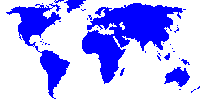
let’s look at density in Europe as a map.
Internet
hosts per 1000 inhabitants
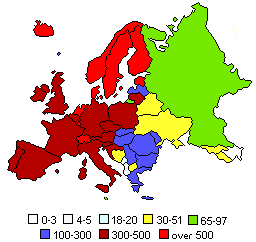
This map looks quite different compared to previous years
(see eleven maps from 1996 to 2006.)
But the strongest development remains concentrated in six
countries – the Scandinavian area and the Netherlands
(with very high density also in Switzerland and Estonia.)
In year 2000 there were four countries in Europe with over 100
internet hosts per thousand inhabitants – Iceland, Finland,
Norway and the Netherlands. Now there are thirtyfive.
There will probably be other changes – but relevant
trends need to be verified over an extended period of time.
In other data analyses
there are maps of internet
activity
in Asia, Africa
and Latin America.