Data
Data on internet activity in Asia
(hostcount)
One of a series of analyses
by
Giancarlo Livraghi gandalf.it
Updated February 29, 2012
Based on statistics
up to December 2011
The next update will probably be here
in
February or March 2013
Data on internet activity in Asia
(hostcount)
One of a series of analyses
by
Giancarlo Livraghi gandalf.it
Updated February 29, 2012
Based on statistics
up to December 2011
The next update will probably be here
in
February or March 2013
In all parts of the world there are big and changing differences in the development of the internet, but especially in the vast Asian continent that has 60 percent of the world’s population.
The “big news” a few years ago was the growth of India. One of the few countries worldwide that had tripled their hostcount in 2005 over a year earlier. Growth continues, but the available statistiscs are confusing – it isn’t clear why, but it’s pretty obvious that the hoscount for India is largely underestimated.
The opposite is happening with China, where in 2007 there was a “sudden”, and very large, increase. Such a “leap” is hadly belieavable (and there was scarce further growth in following years.) In any case, it will be necessary to see developments in further years to understand the meaning (if any) of this trend. In the meantime, in spite of the doubts, in this analysis the data for China are taken “at face vaue” as reported.
With 114 million internet hosts Asia is in third place after North America and Europe. (For a comparison with other parts of the world, see international data.) But there are huge differences between a few countries, that rank high in internet activity on a global scale, and most of the continent that is still far behind. As we see in this chart that includes the 40 countries in Asia with over a thousand internet hosts (they have 99.99 percent of the total hostcount in Asia.)
Number of hosts
December 2011Per 1000
inhabit.Japan 63,465,680 495.6 China 19,711,904 14.8 India * 18,500,000 15.3 South Korea * 10,000,000 205.9 Taiwan 6,405,566 276.6 Turkey 4,034.284 54.7 Thailand 3,277,550 50.3 Israel 2,185,740 282.8 Singapore 1,932,116 512.2 Indonesia 1,341,390 5.7 Hong Kong 861,516 123.0 Saudi Arabia 481,880 17.8 Philippines 469,029 5.0 Malaysia 384,442 13.9 Arab Emirates 381,915 81.1 Pakistan 340,834 1.8 Cyprus 253,391 315.6 Viet Nam 175,612 1.7 Iran 167,453 2.2 Jordan 120,293 19.7 Kyrgyzhstan 116,586 21.0 Bangladesh 69,285 0.4 Kazakhstan 65,988 4.1 Lebanon 64,525 15.2 Uzbekistan 55,088 2.0 Bahrein 55,498 41.0 Brunei 51,593 120.8 Palestine ** 46,775 18.4 Nepal 43,928 1.5 Yemen 33,297 1.4 Mongolia 20,865 7.6 Bhutan 14,714 21.1 Cambodia 13,768 1.1 Oman 13,488 5.0 Sri Lanka 9,315 0.5 Syria 8,114 0.4 Kuwait 3,289 0.9 Maldives 3,054 9.7 Laos 1,661 0.3 Burma (Myanmar) 1,033 0.02 on .asia domains 2,766 Asia 114,000.000 26.8 excluding Japan 50,000,000 12.4 * Hostcount figures for India and South Korea appear understated at this time
and therefore the numbers are arbitrarily, but not unreasonably, increased.
This is so also in the graphs.
The “invention” of a generic “asia” top-level domain turns out to be quite useless.
2,766 hosts is an extremely small number compared to 114 million in Asia.If we exclude Japan from the data, density
in the rest of Asia is 12.4 hosts per thousand inhabitants.The world average is 67 hosts per thousand inhabitants.
Only nine countries in Asia have higher density.** Palestine, not yet formally recognized as an independent state, can’t have a national top level domain as such. But the Palestinian Authority in Ramallah has been able to have the .ps tld – that works practically in the same way. As we can’t know to what extent it is used in Palestine or by people living in other countries, the density figure is uncertain. In any case, the tld is a relevant tool for national identity.
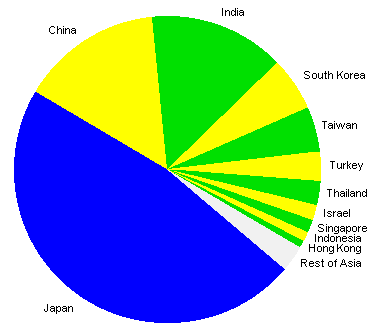
Japan has a dominant role in Asia – as we see in this “pie” chart that includes the eleven countries in Asia with over 500,000 internet hosts (that have 97 percent of the online activity in the continent.)
11 countries
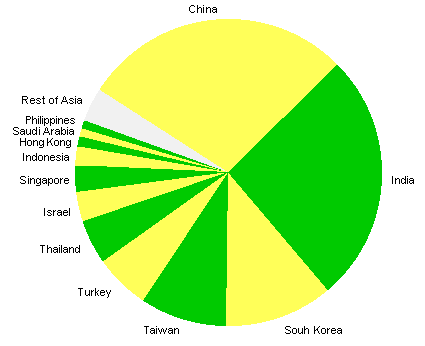
If we remove Japan from the graph, this it he picture for the other 12 countries in Asia with over 400,000 hosts.
12 countries
“Small” countries with less than seven million inhabitants, such as Israel and Hong Kong (that continues to have its own identity online, separate from China) or with less than four million, as in the case of Singapore, have greater activity online than much larger countries.
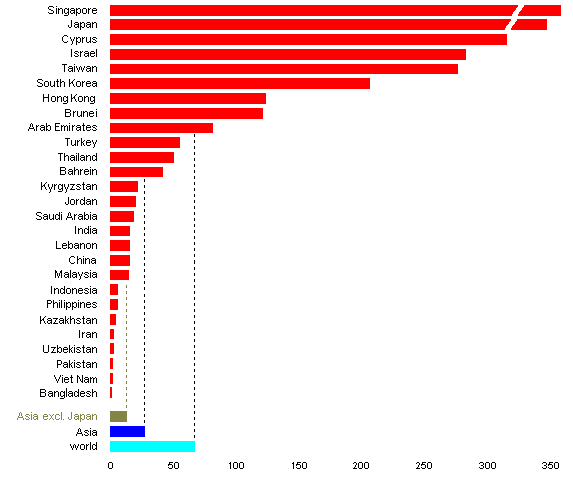
The differences are obvious in this graph of density (hosts per thousand inhabitants) in the 27 countries in Asia with over 50,000 internet hosts.
Internet hosts per 1000 inhabitants
in 27 countries in Asia
For better readability of the chart, the size of Singapore and Japan is reduced by 30 percent
As observed in the international data analysis, in the two largest countries in the world internet use (even with recent gowth) is still very limited in relation to population.
While in other Chinese-speaking countries and communities there is widespread internet activity, in mainland China the use of the net is severely centralized and repressed (and there is strict censorship also on all other information and communication.)
The figures for India in this analysis are deliberately increased, to a level that is quite reasonable though it has not, so far, been “mathematically” measured by statistics. Of course the potential is much larger.
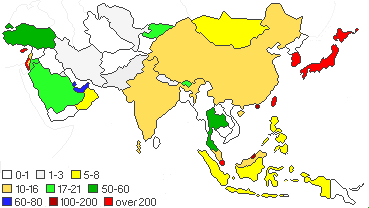
The picture can be summarized in a map that includes the central and southern part of the continent, from the Middle East to East Asia.
Internet hosts per 1000 inhabitants
This map si more “colored” than it was in past years.
There are recent developments
(especially, but not only, in India and China).
Density in many countries is still very low,
even when compared to the Asia average,
but there are fast changes.
Only a few countries have high density and they are isolated places on the map. There would be a few tiny (though relevant) “dots” if we could identify specific urban areas in some low-density countries. But the general picture confirms a very unbalanced situation in Asia.