No. 67 – December 27, 2002 |
Other articles on similar subjects
are published in English
in the monthly Offline column
|
 |
1. Editorial: The “dotcom” syndrome |
|
|
It’s quite surprising to notice how many people think
that everything online is a “dot com”. This isn’t
just a matter of not understanding how the domain name system
works – or how the internet is organized. It’s also an
assumption that everything online is “commercial”.
There are even non-commercial organizations (including
some that run training programs on how to use the internet)
with websites or mail systems based on “.com”
domains. (On other oddities in the use and trading of internet
domains see Domain
carpetbaggers.)
Since mainstream media, around 1994, began to discover
the existence of the internet, attention has been
concentrating on “commercial” use of networking. By
doing so, they confused the issue. The resulting cycles of
hype and hangovers have done considerable harm and no good.
In spite of so many failures, the misunderstanding continues.
It’s boring, and somewhat depressing, to repeat it once
again. But the fact is that the basic structure of the
internet isn’t commercial. The more it’s good for humanity,
the better it is for business. A dotcom-based network
wouldn’t be much of a market. It would be just another
basement section of a department store. What the internet
really is – a vast and ever-growing complexity of countless
human communities and relationships – provides a much more
interesting and rewarding potential also for business. As
long as its vital, organic structure is understood, respected
and treated with genuine care.
back to top
|
|
2. Christmas thrift |
|
|
In many places around the world people have spent less on
seasonal gifts. Shopkeepers may be disappointed, but there is
wisdom in that trend. Time will tell, in months and years to come
– this may be more than the temporary effect of uncertain times.
In business environments that have always been in favor
of growth as such, and consumer spending as a need for
economic recovery, there begins to be a perception that
things may be changing. In “affluent” economies
people and families are cluttered with more goods than they
need. They are beginning to realize that they don’t have
enough room for all the stuff they are buying (or receiving
as presents.) They are getting tired of adding to clutter
just for the sake of “more.”
The sellers of high-tech gadgets have been particularly
disappointed this year. Prices are likely to drop after the
holiday season. But, even so, it remains to be seen if large
numbers of people will still be interested in buying the
latest device “just because it’s new.”
This isn’t poverty and it isn’t recession. It’s
just a feeling that “enough is enough.” . Nobody
can predict if it will develop into a consistent attitude over time,
or there will be more ups-and downs with some fashions and fads
finding a market while others fade out. But that fact is
that not everyone is willing to buy or give things that
nobody really wants.
It was somewhat comforting, this year, to read less of
the usual nonsense about the Christmas season being the
crucial test, the “win or die” event for online
selling. With less noise and hype, some e-commerce traders
did quite well, with people using the net to find better
value and more comfortable shopping.
That may be more than a seasonal whim. Where more
“mature” buying patterns prevail, more people are
likely to use the net to check and compare price, quality and
value. That’s an interesting opportunity, as long as we all
understand that success is not based on hasty and shallow
gimmicks, but on the gradual building of mutual trust and
long-lasting relationships.
back to top
|
|
3. Decline and fall of online ads |
|
|
This short report is based on Italian data – but similar
trends are reported in several other countries. Advertising
spending, as a whole, declined in 2001 and 2002, though a
year-end summary was less disappointing than several sources
had indicated in previous months. The deflation of the
1999-2000 “bubble” caused a less dramatic decrease
than could have been expected. It remains surprising that the
media owners and business circles sere caught by surprise –
analyses published in January 2001 were still projecting
increases.
On December 10, 2002 (as every year) a report on advertising
expenditure in Italy was published by UPA
(the advertisers’ association.) It showed a decline in mainstream
media in 2001, and more so in 2002, with projections of no
increase in 2003 and some possible growth in 2004
(international sources are somewhat more optimistic about
next year, though predictions are always uncertain – and even
more so in a troubled economic environment.) Figures are online in the
Italian version of this report.
Online advertising suffered more than any other category.
That, of course, isn’t surprising – but there is a dramatic
difference between the actual trend and what the business
environment was expecting. As shown in this chart.
Online advertising in Italy
1999-2002
and 2003 “forecast”
(millions of euros)

The green line
shows the forecast that was published in January 2001.
A new estimate
for 2003 (red “dotted” section) is a revised projection
by
the same source based on 2001-2002 results.
Projections made by the “most reliable” sources
at the beginning of 2001 appeared to be “conservative”
compared to much more ambitious expectations in previous years.
But, even so, they turned out to be grossly exaggerated. For several
months in 2002 business sources (and comments in newspapers
and magazines) indicated that, while mainstream advertising was
decreasing, online ads were growing. They were wrong
on both scores. The decrease in advertising as a whole is less than
they expected – while the decline of online ads (from a very
small “peak” in year 2000) is proportionally much larger
that in any other category. Online advertising is around 0.2 percent
of the total in “traditional” media.
Even the “verified” data for past years aren’t
accurate. The blue line shows a more realistic estimate
(considering the fact that at least half of the online
advertising expenditure isn’t “real money” but an
exchange between companies that are, at the same time,
sellers and buyers of web ad space.) The total amount of
money available for the entire online advertising market is
substantially less than the revenue that was expected a few
years ago by each one of the large “portals.”
Spam, flashy design, animations, pop-ups, a variety of
invasive tricks and other gimmicks, often combined with poor
content, have accelerated the catastrophe of online
advertising. It’s hard to predict the future. Growth is
possible, over time, but it needs some radical re-thinking of
strategies and much greater care in development.
Earlier comments on this subject are online in issues
6, 16,
44 and 56.
back to top
|
|
4. European data (update) |
|
|
There are no major changes since a summary of European
internet data was published in issue 65
(August 2002.) As usual, a more detailed analysis is online in the
data section.
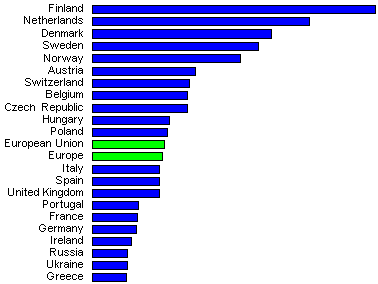
The total hoscount in Europe is close to 25 million. This is
an update of the situation in the 21 European countries with more
than 100,000 internet hosts.
| |
Number of hosts
November 2002 |
% of
Europe |
Per 1000
inhabit. |
| Netherlands |
3,054,236 |
12.3 |
193.3 |
| Italy |
2,958,899 |
11.9 |
51.6 |
| Germany |
2,923,327 |
11.8 |
35.6 |
| United Kingdom * |
2,711,078 |
10.9 |
46.1 |
| France |
2,052,770 |
8.3 |
34.7 |
| Spain |
1,682,434 |
6.8 |
42.5 |
| Finland |
1,217,983 |
4.9 |
234.2 |
Sweden |
1,187,942 |
4.8 |
133.5 |
| Denmark |
872,328 |
3.5 |
164.6 |
| Belgium |
832,853 |
3.4 |
81.7 |
| Russia |
800,277 |
3.2 |
5.5 |
| Poland |
731,371 |
2.9 |
18.9 |
| Austria |
720,587 |
2.9 |
87.9 |
| Switzerland |
667,509 |
2.7 |
90.2 |
| Norway |
634,098 |
2.6 |
140.9 |
| Czech Republic |
362,083 |
1.5 |
36.2 |
Portugal |
266,991 |
1.1 |
27.0 |
| Hungary |
228,303 |
0.9 |
22.8 |
| Greece |
184,716 |
0.7 |
17.4 |
Ireland |
136,463 |
0.6 |
36.9 |
| Ukraine |
130,569 |
0.6 |
2.6 |
| European Union |
20,776,471 |
83.4 |
55.6 |
| Europe |
24,902,774 |
|
35.5 |
* The figure for the UK is probably “underestimated”
(and therefore it’s slightly adjusted in the graphs)
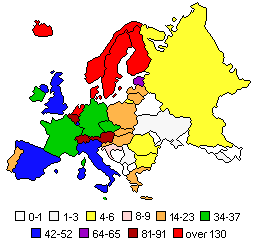
This is an update of the graph on density (hosts per thousand inhabitants.)
Internet hosts per 1000 inhabitants
in 21 European countries

Let’ look at the density picture as a map.
Internet hosts per 1000 inhabitants
And here is, as usual, a graph of hostcount in relation to income.
Internet hosts in relation to income (GDP)
in 21 European countries
There is continuing evolution in several countries. But the general picture, of course, doesn’t change in a few months. A more relevant update will probably be available in February or March 2003.
|
|
