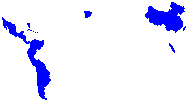
In 2003 there were two countries worldwide with over seven
million internet hosts (the US and Japan.) Now there are ten.
But they are twelve if we consider as “nations” the
Spanish-speaking community and the Chinese ethnic environment.
In the Chinese area a single country, Taiwan,
exceeded the million hostcount in 2001, two million in 2002 and four
million in 2006.
In the Spanish-speaking community Spain had over
a million hosts in 2001, Mexico in 2002, Argentina in 2004.
But the
two “culture areas” are much wider – and also in the
internet they largely exceed the size of individual countries.
In Latin
America Brazil had a million hosts in 2001, two million in 2002, three
in 2003, five in 2005 and seven in 2006. The Portuguese language area,
including Brazil and Portugal, now has nine million internet hosts.
The Spanish-speaking area includes 500 million people (nine tenths
of which are in the American continent.) They don’t speak
“identical” languages but they understand each other and share
culture and knowledge. This is, after English, the second largest language
community in the “western” world.
The Chinese community is much larger, with over 1,300 million people
separated by national borders (and also by considerable ethnic differences)
but sharing a common culture (not the same spoken language, as there are
sixteen different Chinese languages – but they all share the same
“ideographic” alphabet.)
The general picture can be summarized in this chart – twelve
“nations” with over six million internet hosts in 2006.
For a more detailed analysis of 57 countries worldwide see the
report on international data.)
| |
Number of hosts
December 2006 |
Per 1000
inhab. |
| United States |
230,000,000 |
777.9 |
| Japan |
30,800,000 |
241.4 |
Spanish language |
18,800,000 |
45.6 |
| Germany |
13,100,000 |
158.7 |
| United Kingdom |
13,000,000 |
216.5 |
| Italy |
12,000,000 |
204.2 |
| France |
10,300,000 |
169.8 |
| Netherlands |
9,000,000 |
558.1 |
| Portuguese language |
9,000,000 |
45.9 |
| Australia |
8,600,000 |
422.7 |
| Canada |
8,500,000 |
263.4 |
| Chinese culture |
8,200,000 |
5.9 |
World average density is
33.3
In
this analysis figures
are decreased for Italy
and increased for the UK and
Canada
(see international data.)
With increasingy fast growth the Spanish-speaking community
is now ahead of all countries except the United States and Japan,
while at this point in time the Chinese area doesn’t appear
to be as comparatively strong as it was three years ago. But both
still have large potential for further development.
This graph shows the situation of the seven largest language
areas (exluding the English-speaking countries and Japan.)
Internet
hosts
Numbers
in thousands
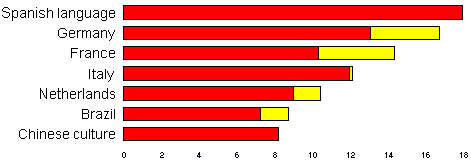
The
yellow sections are estimates of language extensions.
In
the case of France, the French-speaking areas in Canada, Belgium and
Switzerland.
For Germany, Austria and German Switzerland.
For
the Netherlands, the Flemish in Belgium.
For Brazil, Portugal
– i.e. the extension of the Portuguese language area.
Only
a small part of Switzerland is added in the case of Italy.
(Some
“small” countries for each of the languages are not
included
because adding them wouldn’t change the graph.)
Of course the dominant language is English, with a total hostcount
of approximately 300 million (two thirds of the total) if we consider
only countries where English is the “official” language
– if we included all environments where English is understood
it would be close to 90 percent. However other languages have a relevant,
and growing, presence online.
The size of the Spanish-speaking area includes an approximate estimate
of the “hispanic” communities in the United States.
If we consider the use of French and German in some high-hostcount
countries those two language areas have a strong presence in the internet
– but they are not growing as fast as the Spanish community.
Another fast-growing area is the Portuguese language – mostly
because of increasing internet activity in Brazil, but there is also fast
development in Portugal.
It is to be considered that most people with high education
in Portugal and Brazil understand Spanish. If we combined the two language
areas the total would be twentyseven million internet hosts.
The Chinese area has obvious potential for further growth.
If the severe restrictions of internet use in mainland China could
be overcome, the Chinese community would probably replace
Japan as the second largest worldwide after the United States.
But (even when including a “sudden” increase
in mainlad China) development in the Chinese area in recent years
is slower than in the Spanish and Portuguese environments,
as we see in this graph.
Internet hosts –
1999-2006
Numbers
in millions
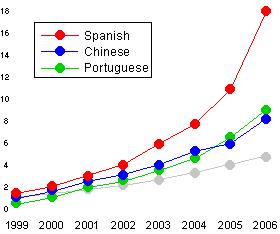
The grey
trend is an index
based on percentages of worldwide growth.
Of course trends need to be understood over longer periods than
one or two years. But the Chinese area is obviously far below its potential
– and it appeared to have slower growth in 2005 than in earlier trends.
Inside each of the two “large culture areas” there are
considerable differences, as we see in the following analyses.
The Spanish language area
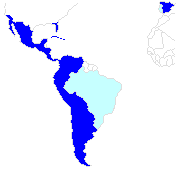
Spanish is the most widely spoken language
in the American
continent.
Some areas in this map
in the South of the United
States
are a “symbolic” representation
of the
Spanish-speaking communities
that, of course, are extended
also
to other parts of the country.
Obvioulsy the pale blue parts of this
picture
show the Portuguese-speaking area.
In recent years there has been fast growth of the internet
in Spanish-speaking areas and especially in some Latin American
countries. The situation is summarized in this chart, from two
points of view: Latin America (including Brazil) and Spanish
language (including Spain.)
There are 21 countries in those areas with over a thousand
internet hosts.
| |
No. of hosts
December 2006 |
Per 1000
inhabit. |
| Brazil |
7,422,440 |
40.3 |
| Mexico |
6,697,570 |
65.0 |
| Argentina |
1,838,050 |
47.6 |
| Colombia |
721,114 |
15.7 |
| Chile |
621,565 |
38.2 |
| Peru |
269,981 |
9.9 |
| Uruguay |
182,403 |
56.0 |
| Venezuela |
122,404 |
4.6 |
| Dominican Rep. |
98,180 |
10.9 |
| Guatemala |
49,062 |
4.0 |
| Ecuador |
27,923 |
2.1 |
| Nicaragua |
24,690 |
4.5 |
| Bolivia |
20,085 |
2.3 |
| Paraguay |
13,178 |
2.4 |
| Costa Rica |
12,751 |
3.0 |
| El Salvador |
12,429 |
1.1 |
| Panama |
9,626 |
3.1 |
| Honduras |
4,485 |
0.6 |
| Cuba |
2,658 |
0.2 |
| Latin America |
18,150,000 |
34.6 |
| Spain ** |
6,800,000 |
154.7 |
| Andorra |
14,994 |
195.0 |
| Spanish language * |
18,000,000 |
45.6 |
* Hostcount
figures for Spain appear understated at this time
and
therefore the number is arbitrarily, but not unreasonably,
increased.
* The
total for Spanish language includes an approximate estimate
of
“hispanic” communities in the United States.
As in all parts of the world, there are large differences, as is visible
in this chart (nine countries with over 90,000 internet hosts,
that have 98.8 percent of the total in Latin America.)
9 countries
in Latin America
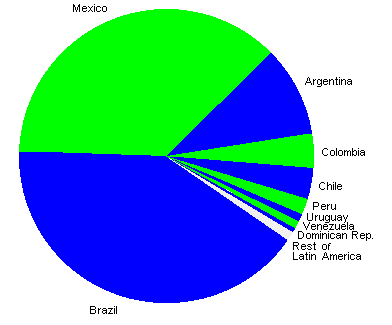
82 percent of the total is in three countries: Brazil, Mexico
and Argentina.
If we look at the same situation for the Spanish-speaking area, the picture
is different (of course Spain replaces Brazil.)
9
Spanish-speaking countries
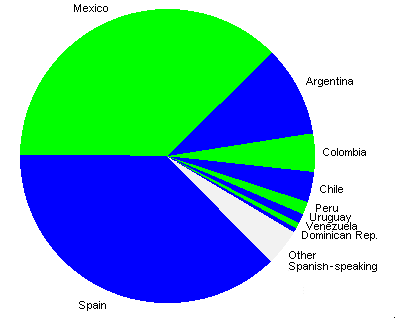
The size of the gray
“slice”, in addition to other Latin American countries,
includes
an approximate estimate of Spanish-speaking areas, especially in the US
Let’s see now, as we do in the other data
analyses, density in relation to population. The graph includes (in addition
to Spain) seventeen countries with over 10,000 internet hosts, that have
99.9 percent of the total in Latin America .
Internet
hosts per 1000 inhabitants
in 17 Latin American
countries
(and Spain)
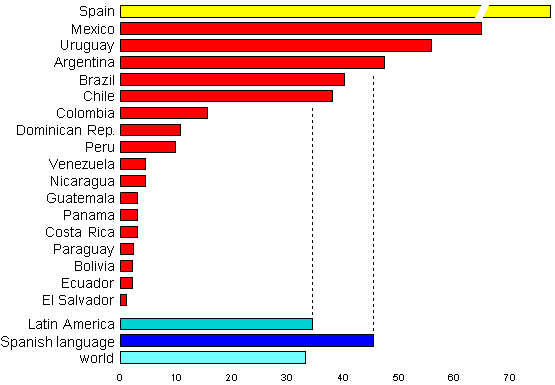
Density in Spain,
here reduced for graph readability, is twice as large as in Mexico.
In 2006, for the first time, Mexico has overtaken Uruguay and
Argentina – and, for the first time, density in Latin America
is higher than the world average. But the above-average countries
in this area are still the same five, including Brazil and Chile.
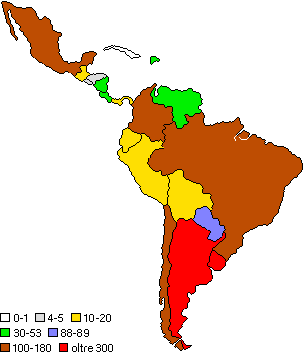
This is the density picture in Latin America seen as a map.
Now let’s look at the situation (for the same seventeen countries)
in relation to income. Here again, Spain is added for the sake of comparison
in the Spanish-speaking environment.
Internet hosts in relation
to income (GDP)
in 17 Latin American
countries
(and Spain)
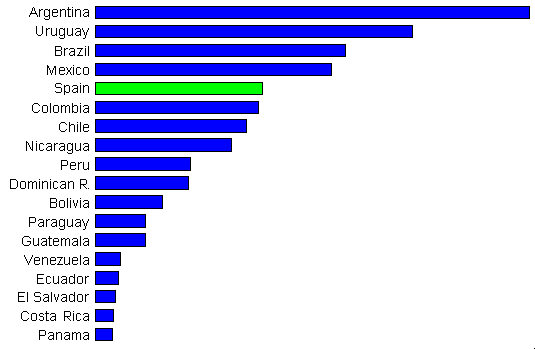
The picture continues to evolve. Four Latin American countries, when
internet activity is measured in relation to income, are ahead of Spain
– and also of other European countries, as shown in the
international data analysis.
The Chinese culture area

There can be no clear definition of the Chinese “territory”
because there are Chinese communities in many parts of the world
(including the United States and Europe.) But obviously
the “large numbers” are in China – and, especially
in relation to the internet, in Taiwan, Hong Kong
and parts of South-East Asia.
It’s too soon to tell if a large and sudden “leap”
in China, in the second half of 2006, is leading to a new trend. But
hostcount in relation to population and income remains very low
(see Asia.)
In the People’s Republic of China, in addition to
technical and economic problems, there are severe restrictions
in the use of the internet. The situation is radically different
in Taiwan and in Hong Kong (that, though it is now part of China,
still has a separate presence in the internet) as well as in
Singapore and in other parts of South-East Asia.
The picture can be summarized in this short table.
| |
No. of hosts
December 2006 |
Per 1000
inhab. |
| China |
1,933,919 |
1.5 |
| Hong Kong |
801,298 |
116 |
| Taiwan |
4.418,705 |
194 |
| South-east Asia * |
810.000 |
85 |
| Total ** |
8,200,000 |
5.9 |
* An estimate based on the Chinese population in countries such as Singapore and Malaysia.
** The total is “rounded up” to include other Chinese communities worldwide.
Let’s look at this picture as a “pie” chart.
Chinese cultural area
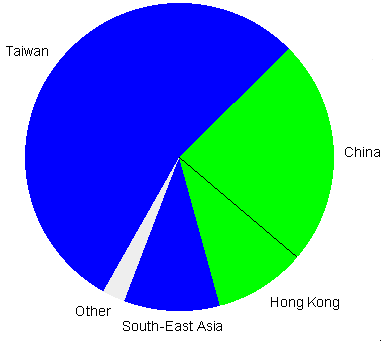
The size of the gray area
is not a number calculation
but an approximate indication of the
fact
that there are “other” Chinese communities
There still is a dominant position of Taiwan, that with twenty million
inhabitants has twice the internet hosts of mainland China. For
the first time in the history of the internet, Hong Kong doesn’t
have a larger hoscount than the rest of China, but the fact remains that,
with seven million inhabitants, is has 40 percent the hosts that are found
in the mainland (1,250 million people.) There is relatively strong
internet activity also in the Chinese communities in South-East Asia
(for instance the hostcount in Singapore, with under four million
inhabitants, is nearly half in the number in China.)
In spite of some changes, such as the recent growth in China,
the whole area isn’t developing as fast as in previous years.
Of course it will take more time to understand the meaning of these
trends. It is likely that the Chinese culture area will continue to grow,
but any forecasting would be unreasonable.
For a perception of where these activities are placed geographically,
this little map might help. It includes the central and southern part of the
continent, from the Middle East to East Asia.
Internet
hosts per 1000 inhabitants
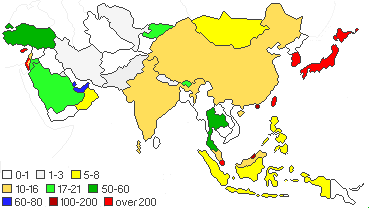
Only a few countries have high density and they are isolated spots
on the map. There would be a few tiny (though relevant) “dots”
if we could identify specific urban areas in some low-density countries.
But the general picture confirms that only a small part of Asia is strongly
active in the internet.

A more detailed analysis
of this situation
is in a report about the
internet in Asia
